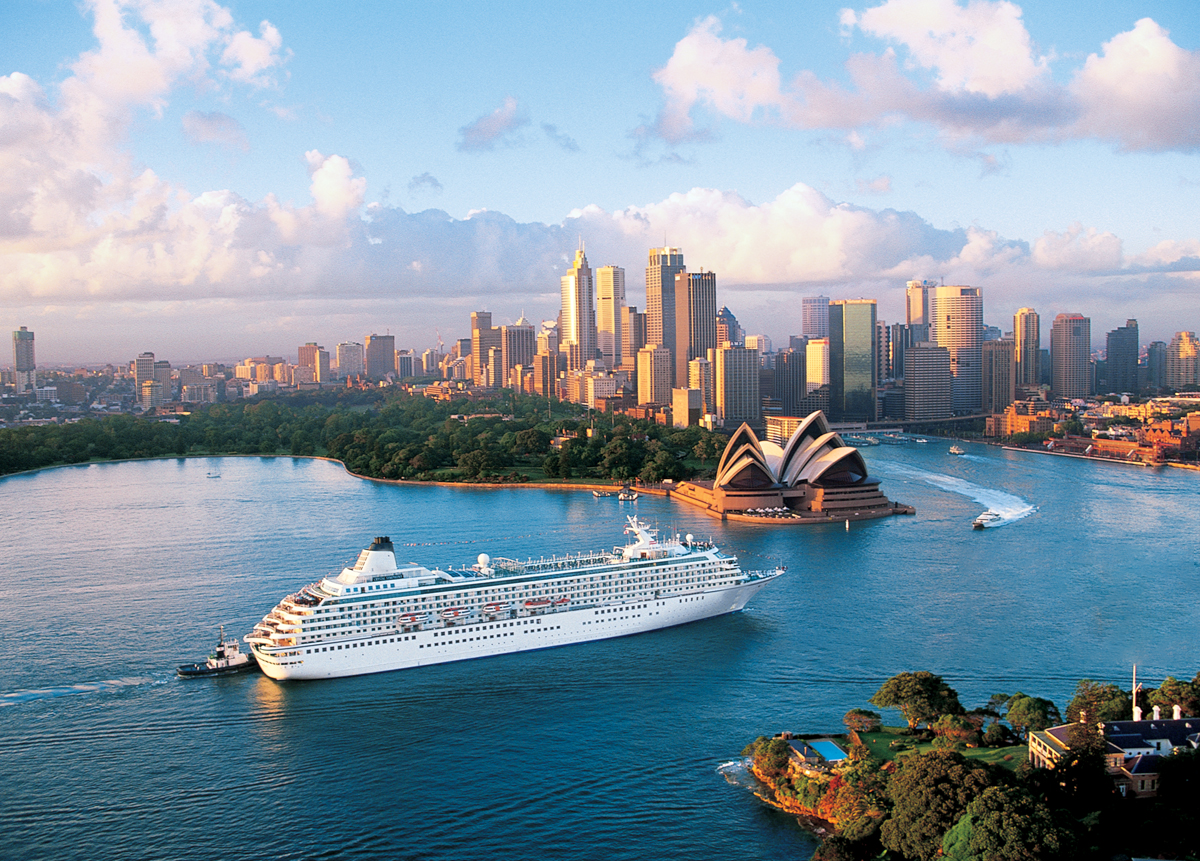
The Australian cruise industry has shown an 11.2% increase in its total value to the national economy, contributing $5.2 billion in direct and indirect output during the 2018-19 financial year.
 Figures released today in the latest annual Economic Impact Assessment commissioned by Cruise Lines International Association (CLIA) and the Australian Cruise Association (ACA) show cruise tourism continues to make a major positive impact on the economy.
Compiled by AEC Group, the independent assessment found the equivalent of 18,135 full time jobs were supported by the cruise industry in 2018-19, a 6.6% increase on the previous year.
It says 1,240 cruise ship visits led to 3.8 million passenger and crew visit days, resulting in direct expenditure by passengers, crew and cruise lines totalling $2.5 billion.
CLIA Australasia Managing Director Joel Katz said the strong growth in economic contribution had been driven primarily by increased spending by cruise passengers.
“Total cruise passenger spending in 2018-19 increased 17.4% on the previous year to reach almost $1.4 billion,” Mr Katz said. “Cruise passengers now spend an average of $387 each for every day they’re on shore in Australia, which provides enormous benefits to businesses like hotels, restaurants, tour operators and retailers.”
ACA CEO Jill Abel said cruise ships had visited 47 different ports around Australia last financial year, bringing tourism to some of the most remote coastal communities in the country.
“The economic impact of cruising is not only enormous and growing, it’s also reaching locations that might otherwise be difficult for visitors to access,” Ms Abel said. “The diverse range of ports Australia offers around its coast is attracting more and more cruise lines, while also spreading the economic benefit of cruise tourism to the furthest corners of the continent.”
Other key highlights from the report include:
- The accommodation sector was the biggest beneficiary from cruise passengers, receiving $450 million or 33.3% of their combined spend.
- The food and beverage sector accounted for almost $274 million or 20.3% of passenger spend, followed by transport ($196 million, 14.5%), retail ($159 million, 11.7%), shore excursions ($133 million, 9.8%) and entertainment ($59 million, 4.4%).
- At the start or end of a cruise, international visitors spent the most per day on shore, averaging $569 each, compared to domestic travellers who spent $436 per day.
- In a transit port, international visitors each spent an average of $211 per day on shore, while domestic travellers spent $174 per day.
- Cruise ship crew members each spent an average of $173 per day while in port, making a combined expenditure of $35 million in 2018-19.
- Cruise lines contributed direct expenditure of almost $1.1 billion – an increase of 4.6% on the previous year – spent on items including fuel, food and beverage supplies, port charges and fees, and administration.
- NSW received the greatest share of direct expenditure from the cruise industry, receiving $1.55 billion including $1.54 billion in the key gateway port of Sydney.
- Among other states, Queensland received direct expenditure of $490 million, followed by Victoria ($168 million), Western Australia ($109 million), South Australia ($67 million), Tasmania ($49 million) and the Northern Territory ($31 million).
Mr Katz said the cruise industry had defied current berthing constraints in Sydney to achieve a high rate of growth in its national economic contribution.
“A lack of available berthing space in Sydney has made it difficult for the cruise industry to increase its capacity in Australia, but this has been countered by significant increases in the amount of spending by cruise passengers,” Mr Katz said. “In the future we look forward to achieving a solution to Sydney’s infrastructure constraints, while at the same time benefitting from investment in other ports such as Brisbane, Cairns, Broome and Eden which are improving their ability to welcome cruise ships.”
For an infographic, click here.

.jpg)
.jpg)
